
Products — How it works
This page will detail sensors, connectivity and automation flows. For now, here is a brief outline.
Sensor-first platform
We capture CO₂, PM2.5/PM10, humidity and temperature to drive real-time ventilation and filtration decisions.
APIs and integrations
Native integration with HVAC, BMS and IoT platforms enables on-demand automation and reporting.
FULL STATISTICAL CONTROL
Anticipate, control and optimize your processes in real time
Statistical process control allows you to anticipate errors before they affect your users or your production, ensuring maximum quality and reducing costs associated with non-conformities or unplanned shutdowns. It also helps you comply with the most demanding regulations in your sector, converting data into intelligent decisions and immediate actions.
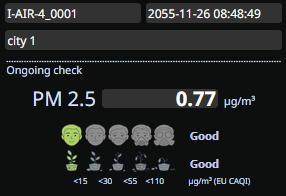
Real-time snapshot with index thresholds and status.
This data allows you to visualize the last current state of the process and compare it with the established limits, immediately identifying whether the data is within the control zone or if it is approaching alerts (icons). Ideal for acting quickly in case of deviations and maintaining air quality or the process within optimal parameters.
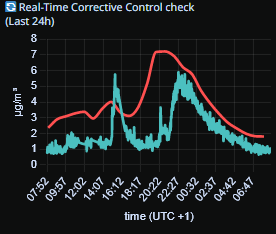
(Last 24h)
Live feedback compares signals and triggers immediate corrective actions.
Real-time analysis of the last 24 hours, comparing process signals with statistical control limits (+2σ vs data registered). This graph detects anomalous trends (e.g. sudden spikes or excessive noise) and triggers automatic alerts to correct deviations before they affect the process. Allows you to proactively adjust operating parameters (e.g. airflow, temperature), avoiding shutdowns or non-conformities.
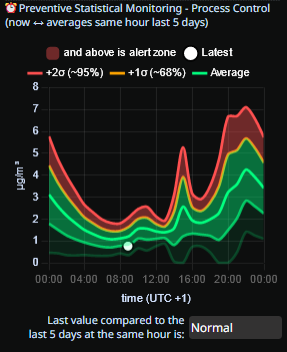
Now vs. same-hour last 5 days using ±1σ/±2σ bands to anticipate deviations.
Statistical Process Control: comparison of current data with that of the same hour of the last 5 days, using control bands (±1σ and ±2σ) to anticipate deviations. This analysis identifies recurring patterns (e.g., peak hours, seasonal trends) and allows you to anticipate potential problems before they occur on a daily maintenance or adjusting based on historical trends, ensuring long-term process stability.
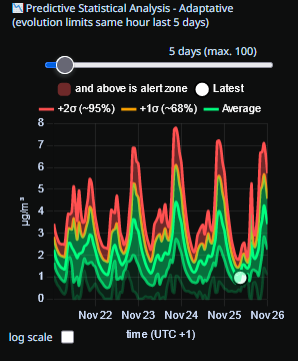
Adaptive hourly control limits forecast expected ranges and flag early trend breaks.
Predictive analysis with adaptive control limits, which adjust the expected ranges (±2σ or ±3σ) based on historical data and recent trends. This graph predicts changing trends (e.g.: seasonal increase in particles, temperature variations) and warns in advance when trend breaks are detected (e.g.: noise, anomalous rises or falls). It allows you to optimize the process in real time, reducing the risk of non-conformities and improving operational efficiency.
Statistical process control is not just a tool, it is your guarantee of quality and efficiency. With the Idonik sensor, detect deviations in real time, act before they become problems and optimize your processes with predictive data.
AUTOMATE THROUGH API
Control the sistem switching on off or adjusting parameters automatically requesting the sensor measurements automatically.
With the API, you can automate the control of your processes by integrating our sensor data into your management systems. If your system is ready, it allows you to activate or deactivate devices, adjust operating parameters and react in real time to environmental or process conditions. All this, without manual intervention, optimizing efficiency and reducing errors.
Our API offers direct access to sensor data in JSON format, a lightweight standard that is easy to integrate into any system. In addition, you can also download historical data in CSV format for deeper analysis or customized reports.
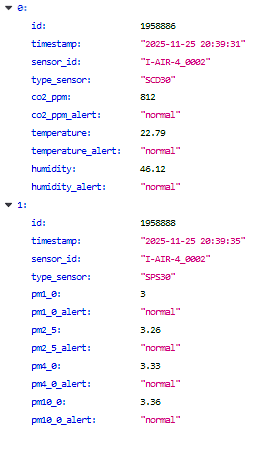
Real-time data obtained through our API. JSON format allows you to easily integrate sensor readings (CO₂, PM2.5, temperature, etc.) into your control systems. Each field includes values and alert states, so you can automate actions based on predefined thresholds.
The JSON (JavaScript Object Notation) format is a lightweight standard for data exchange, easy to read and write by humans and easy to parse and generate by machines. In the context of our sensors, JSON is used to transmit structured data in real time, such as CO₂, temperature, humidity or particle readings. JSON is ideal for integrations with APIs, as it allows you to send and receive data quickly and efficiently. For example, if you want to automate the control of a ventilation system based on CO₂ levels, our API will provide you with the data in JSON format, and your system will be able to process this data and act (e.g. turn the ventilation on or off) without the need for human intervention.
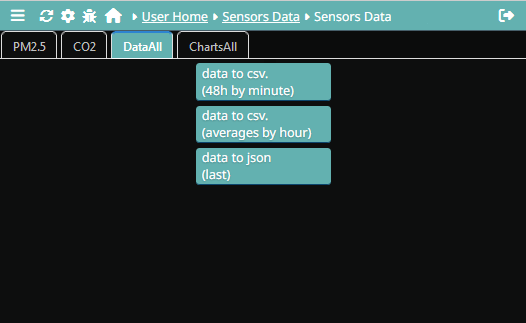
Download historical data in different formats (CSV per minute, per hour or JSON) to analyze trends, generate reports or feed your control algorithms. This tool allows you to export data flexibly and adapt it to the needs of your management or automation system.
The CSV (Comma-Separated Values) format is a simple and universal format for storing tabular data, such as time series of sensor measurements. Each row in the CSV represents a time record (e.g., a reading every minute or hour), and each column represents a variable (e.g., temperature, humidity, CO₂). CSV is especially useful for historical analysis, as it allows you to easily import data into tools like Excel, Python, R, or databases. For example, if you want to analyze air quality trends over the course of a week, you can download the data in CSV and process it to identify patterns, generate graphs, or create predictive models. In addition, CSV is compatible with almost any data analysis software, making it a versatile and accessible tool for both technical and non-technical users.